Educational challenges by the numbers


What indicators of secondary education does Uruguay need to improve? In this part, I will delve into students' academic performance, attendance, repetition, and drop-out. I will also describe how some of these indicators are not homogenous across the population.
Firstly, let’s examine performance. The Organisation for Economic Co-Operation and Development (OECD) implements the Programme for International Student Assessment (PISA) in 81 countries and economies. This test assesses the ability of 15-year-olds “to use their reading, mathematics and science knowledge and skills to meet real-life challenges”(11), making their results comparable across countries.
PISA performance in mathematics by country
PISA performance in reading by country
PISA performance in science by country
Even if Uruguay does not hold a relatively bad position within the region (it is second across the three subject areas, after Chile), it lies well below the OECD average (471 for math, 476 for reading, and 485 for science).
In addition, this poor performance is very unequal between socioeconomic levels. The national assessment “Aristas”(12), implemented by Uruguay’s National Institute of Educational Evaluation (Ineed), evaluates the learning outcomes of students in 3rd year of basic secondary education.
In math, the assessment sets out 6 levels of performance, from below 1 to 5, 1 being the lowest and 5 the highest. In very unfavourable socioeconomic contexts, 86.3% of the students had a performance of level 2 or lower, while in very favourable contexts, 66.2% did.
In the reading assessment, 58.4% of the students in very unfavourable contexts performed at level 2 or less, whereas for students in very favourable contexts, it was merely 9.2%.
Another indicator that is worth mentioning is absenteeism. In total, 6.9% of students attend classes little (meaning they are absent some days every week), while 1.2% attend very little (approximately once every fifteen days).
Frequency of students' attendance at class

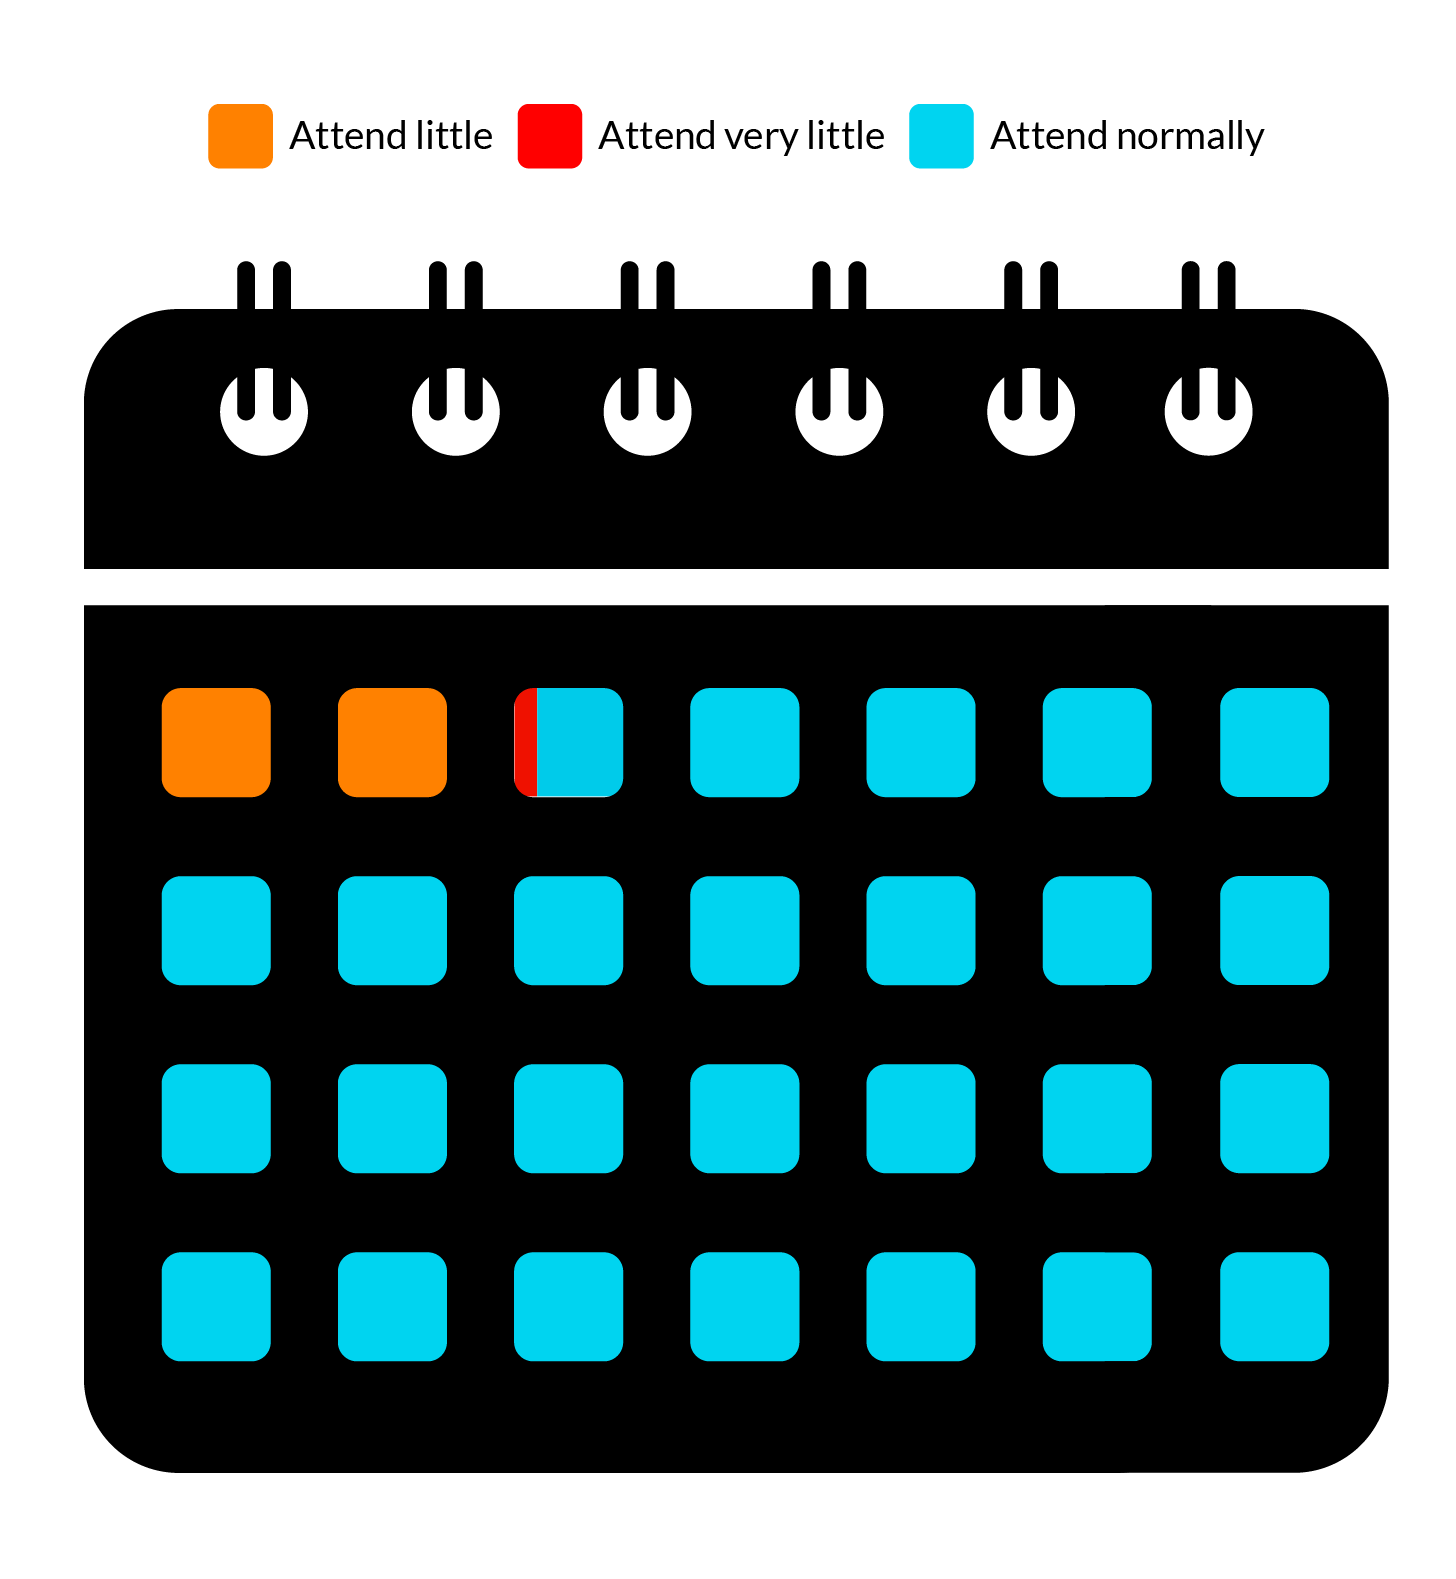
Created by the author using data from Ineed (2022)
Again, this has important socioeconomic disparities, with 3% attending little and very little in very favourable socioeconomic contexts, while 11.2% do so in very unfavourable contexts, almost fourfold.
Both poor performance and absenteeism, individually or together, can cause students to repeat the year. In Uruguay, for a student to repeat the year, they have to have missed 1/6 of the classes or failed more than half of their courses.[1]
According to Aristas, 11.2% of third-year students have repeated at least one year of high school so far. As seen with other indicators, this, too, has socioeconomic disparities:
The difference of 21.3 % having repeated in very unfavourable contexts is almost tenfold than that in very favourable contexts, where only 2.3 % have repeated.
The National Administration of Public Education (ANEP) did a study on educational trajectories in 2022, (13) analysing the matriculation numbers of different cohorts once they finished primary school. This is how attrition operates in secondary education due to repetition and drop-out:
To many education theorists and researchers, the pedagogical practice of repetition is inefficient. This separates students from their age-cohort (many times, of friends), it demotivates them, and it can mean an extra economic burden for families.
All of these factors and barriers highly influence adolescents and young adults to drop out of high school.
It is proven that the older students are, the more their expectations about the future change.
For younger students, up to 15 years old, the main expectation is to attend university. This dramatically decreases by half from the age of 16, and it falls even lower in students aged 17 or more. Unlike most students, whose main expectation is to study at university, the main expectation for older students is merely to finish basic secondary education.
In Uruguay, only 51.6 % of young adults aged 21 to 23 have finished secondary education. However, this phenomenon is not homogeneous across society.
Why do adolescents and young people come to the decision to drop out of high school?
As students face some of the system's barriers, like repetition, it is well documented that other options, like working, become more likely paths to follow. Thus, it is important to analyse drop-out reasons together with indicators like repetition or performance and understand these decisions as the outcomes of a plethora of events that happened along someone's trajectory.
While 91.5 % of adolescents aged 15 to 17 attend high school, only 51.6 % of young adults aged 21 to 23 have managed to finish high school by that age.
What happens in between? Did they drop out, or are they still striving to finish secondary education? What challenges or barriers did they encounter? What do they do in the present?
What are their stories?
[1] This is the framework used for the data analysed and collected in this visual essay, though it must be noted that this has been changed with the new Educational Transformation.